Introduction
When you're managing a SharePoint online tenant you'll probably need to investigate performance on a regular basis. Sometimes users report issues and you'll need to open up a support case with Microsoft.
Without supporting data you'll have a hard time providing the right information to really get a quality reply and perhaps even a solution from MS side.
In this article I provide a way to monitor sharepoint performance by collecting performance and processing information Microsoft provides in every page request.
Prequisites
- a SharePoint Online tenant.
- a desktop/server/Azure Automation account to run a PowerShell script. Locally you'll need the SharePoint Client Components SDK installed.
- An Azure subscription with an Application Insights resource created.
Solution
Although differently for Modern and Classic pages, Microsoft provides some data on how the page request performed at their cloud servers' side like the request duration. Next to that, each page request has a corresponding correlation id that can be used by Microsoft to find errors in their server logfiles.
Here I provide a powershell script you can run on a desktop or in Azure Automation to collect the provided data and send it to Application Insights in Azure. Next to that I'll give a Application Insights query to create a graph of the custom monitoring events the powershell script sends.
In the script you'll need to provide:
- An application Insights key (passed into the script by using a parameter)
- You'll need to add URLs to modern and classic sites in the bottom of the script
- If you run it locally you need to set the path to Microsoft.SharePoint.Client.dll
Application Insights KUSTO query
customEvents
 | where name == "Event sharepoint monitoring script"
 | where timestamp >= ago(14d)
 | extend spRequestDuration = customDimensions.["spRequestDuration"]

 | extend siteType = customDimensions.["SiteType"]

 | summarize avgRequestDuration=avg(todouble(spRequestDuration)) by tostring(siteType), bin(timestamp, 5m) // use a time grain of 5 minutes
 | render timechart
You can add this query in the Azure Portal, when you go to the Application Insights you created and then go to Logs (Log analytics) in the left menu. From there you can Pin the graph to a Dashboard.
End result:
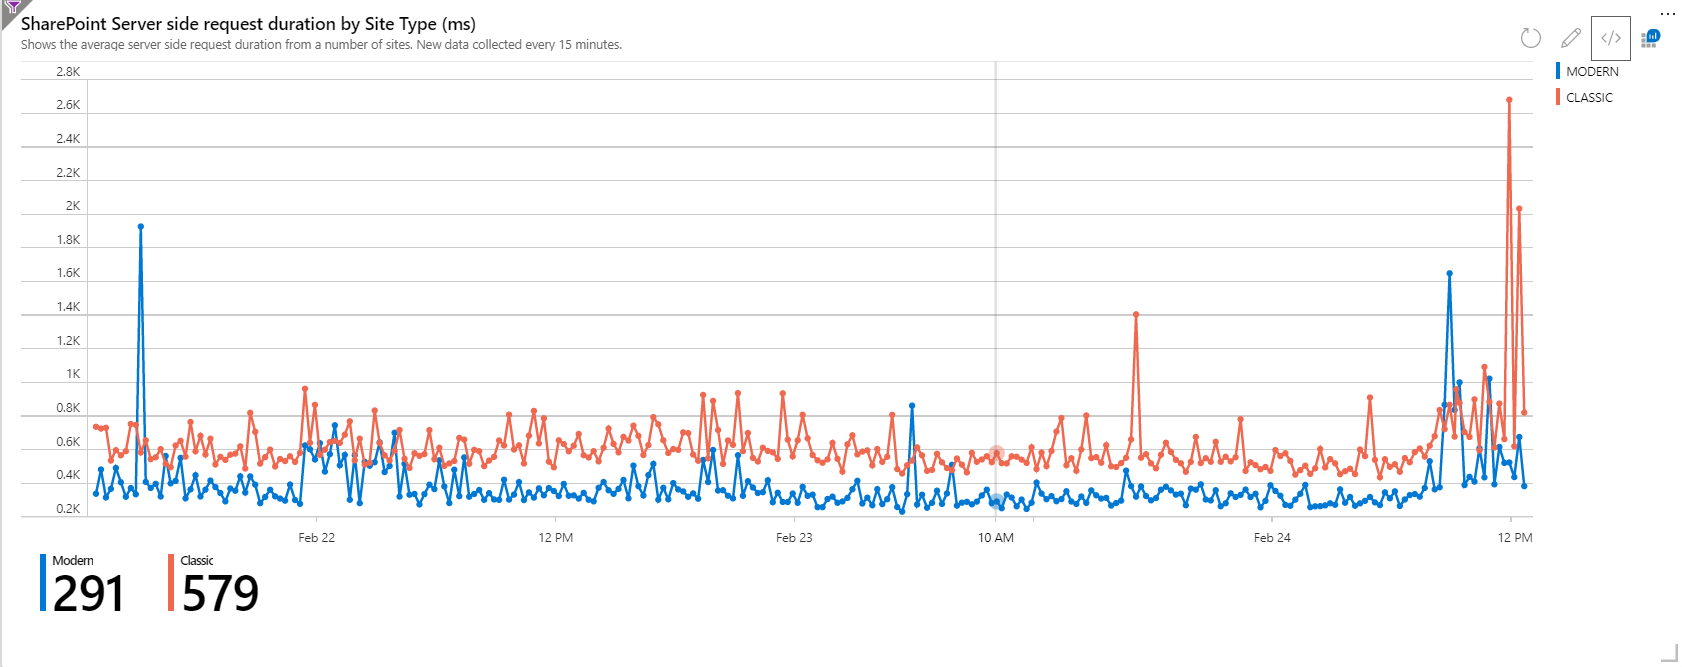
There is no official SLA or guidance on what these values should be, but when you see modern sites showing an average request duration of over 1500ms for more than an hour, you definitely need to open a support case towards Microsoft.